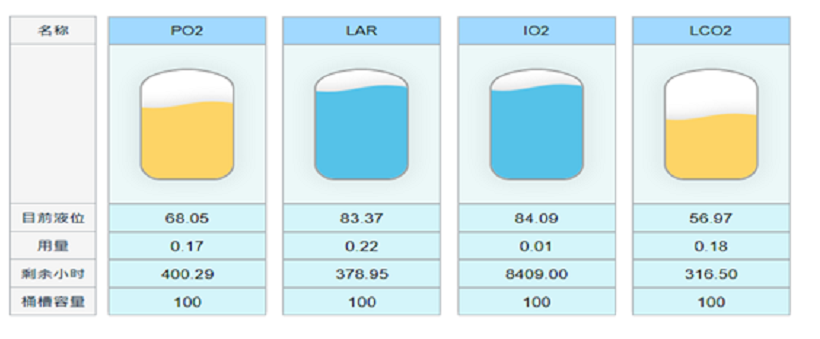
Vue如何生成EChart列表
作者:胡同里的砖头
围观群众:677
更新于:2021-12-17
<template>如下图:
<div class="app-container" >
<el-row :gutter="10" style="padding:20px" class="table1">
<dv-decoration-7 style="width:150px;height:30px; color:white">纯液</dv-decoration-7>
<el-col :span="6"
v-for="(value, key, index) in tankValueList"
:key="index"
>
<div class='wrapper' >
<dv-border-box-12>
<div class="inner" style="margin-bottom: 21px;">
<div class="chartheader">
<span class="empty"></span>
<span class="text">{{value.lorryName}}</span>
</div>
<div class='chart' :id='value.lorryName'></div>
<div class="_content">
<span>液位:{{value.value}}</span>
<span>剩余:{{valHour(value)}}小时</span>
<span>容量:{{value.fill}}</span>
</div>
</div>
</dv-border-box-12>
</div>
</el-col>
</el-row>
</div>
</template>
<script>
import * as echarts from "echarts";
import * as echartsliquidfill from "echarts-liquidfill";
import { getTimeLyLiquidLevel,getTimeLyLiquidLevelW,getCarMessagesCount} from "@/api/bulk-chemical";
import moment from 'moment'
export default {
data () {
return {
activeName: 'pure',
tableCount: 0,
tankValueList:[],
chemicalCount:"",
nowDate: null, //存放年月日变量
nowTime: null, //存放时分秒变量
timer: "", //定义一个定时器的变量
currentTime: new Date(), // 获取当前时间
min:0,
updatetime:moment(new Date()).format("YYYY-MM-DD HH:mm:ss"),
}
},
mounted () {
this.Bind();
},
methods: {
Bind(){
this.getTimeLyLiquidLevelList();
},
async getTimeLyLiquidLevelList() {
var res = await getTimeLyLiquidLevel();
this.tankValueList = res.data
},
async getTimeLyLiquidLevelListW() {
var res = await getTimeLyLiquidLevelW();
this.tankValueListW = res.data
},
initChart() {
var option={
series: [{
type: 'liquidFill',//表明为水球
data: [{
value:0.6,
itemStyle: {
normal: {
color: 'red'
},
}
}],
amplitude: 4,//波浪大小
radius: '80%',
shape: 'path://M60,32s30.582-9.191,51-9c26.779,0.25,50,9,50,9,21.091,7.5,40,20.909,40,43V275a40,40,0,0,1-40,40H61a40,40,0,0,1-40-40V75C21,52.909,40.909,39.75,60,32Zm5,6s23.753-8,46-8c22.747,0,45,7,45,7,19.841,6,40,20.909,40,43V270a40,40,0,0,1-40,40H66a40,40,0,0,1-40-40V80C26,57.909,45.909,44.5,65,38Z',//形状
// center: ['10%', '25%'],
label: {
normal: {
show: false,
formatter: '',//显示的内容
}
},
//背景样式
backgroundStyle: {
color: 'rgba(0,0,0,0.5)', // 水球未到的背景颜色
},
outline: {
borderDistance: 0,
itemStyle: {
borderWidth: 10,
borderColor: {
type: 'linear',
x: 0,
y: 0,
x2: 0,
y2: 1,
colorStops: [{
offset: 0,
color: 'rgba(69, 73, 240, 0)'
}, {
offset: 0.5,
color: 'rgba(69, 73, 240, 0.5)'
}, {
offset: 1,
color: 'rgba(69, 73, 240, 1)'
}],
globalCoord: false
},
shadowBlur: 10,
shadowColor: '#000',
}
},
itemStyle: {//阴影的配置,还可以设置扇形的颜色,在normal中编辑color来设置,设置后的扇形颜色是一样的
normal: {
// 阴影的大小
shadowBlur: 20,
// 阴影颜色
shadowColor: 'rgba(0, 0, 0, 0.2)'
}
}
}]
}
for(var i=0;i<this.tankValueList.length;i++){
var num = this.GetPercent(this.tankValueList[i].value,this.tankValueList[i].fill)
let chart = echarts.init(document.getElementById(this.tankValueList[i].lorryName))
chart.setOption(option);//option可以写公共的chear样式和数据信息,必须重复写代码,增加可复用性
chart.setOption({
if(.....)这里可以根据你的循环条件来显示各种不同数据的chart
series: [{
data: [{
value:num,
itemStyle: {
normal: {
color: num>=0.7?'rgba(0, 108, 154, .8)':num<0.8 && num>=0.4 ?'rgba(189, 126, 12, .8)':'rgba(252, 140, 199, .8)'
},
}
}]
}]
});
window.addEventListener('resize',function () {//执行响应式
chart.resize();
})
}
},
}
</script>

- 本文标题: Vue如何生成EChart列表
- 文章分类:【VueJS】
- 非特殊说明,本文版权归【胡同里的砖头】个人博客 所有,转载请注明出处.